
Have you Heard About Data Visualization?
If not, then you should know that it can change the way how you make decisions, as the tool discovers the hidden patterns and behavior of customers, by connecting the dots.
As a marketer, you would have communicated with many customers, and in the process, accumulated their behavioral data. Data visualization makes you talk with these data with its representation in the pictorial format so that you can get useful insights. It facilitates in concluding a story by bridging the gap between the insights and data so that businesses can plan their strategy accordingly for the better outcome.
Story-telling has become an essential part of any content marketing strategy in recent years, and with the availability of huge data, organizations can weave a good story revolving around their services or products from these data. Data visualization helps you in building an enticing story for showing to your potential customers, in different pictorial forms such as pie charts, scatter plots, bar graphs, etc.
via GIPHY
With increased competition in the market, organizations have to monitor the good volume of data from different sources like human resource, social media, consumer complaints, Google analytics, financial, and others. Data visualization can monitor all the data from different industries, and make a useful presentation to generate the best insights.
The below points explain how data visualization can help organizations in a better decision-making process:
1. Reading between the lines: Complex data are difficult to interpret, but data visualization with its pictorial representation helps to decipher the data easily. It helps in discovering the trends and patterns which otherwise one misses out, if not presented in the data visualization format.
As per a TechCrunch report, GM Cruise will be sharing a software platform to the researchers, engineers, and students, which will help them in getting visual insights by dragging robotics data in the ROS bag file. The company initially designed the software for giving its engineers a good understanding of the data petabytes, which is generated from its fleet of vehicles every month.
 Source: Venturebeat
This visualization software will further help in the R&D activities of individuals and industries.
2. Discoveries about the user: Data visualization helps in making more discoveries about your user. You would be thinking that you have a fair knowledge about your customer, which could be far from the truth. Data visualization dives deeper into the raw data and shows correlations about your customer’s behavior with an appealing pictorial representation. This could be an eye-opener for you as a marketer as the surprising results would make you look into the unrevealed behavioral aspects of your customer.
3. Easily comprehensible: The data available in the organization is a build-up of huge data difficult to comprehend and analyze. Data visualization makes it easily comprehensible with the right graphs and charts for showcasing to the decision maker. It can make the right usage of your data to find the hidden information which otherwise would get lost.
4. Scrutinizing the useful data with a new approach: The presence of huge data makes it difficult to analyze the best one, but with the help of data visualization you can make out which of the data is suitable as per the requirements of your organization.
The tool provides accurate business mapping, which includes chart illustration, fast mapping, demographic data, color coding, and others.
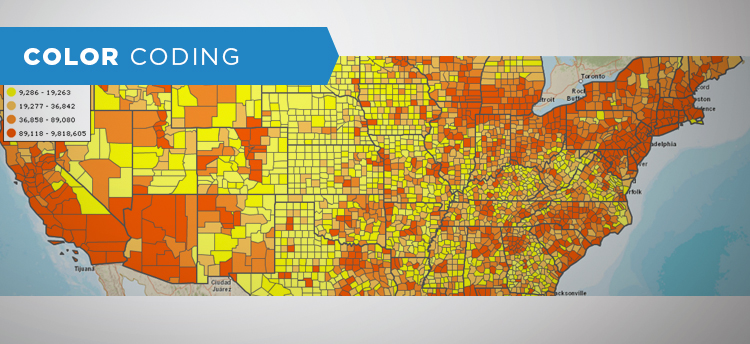 Source: Mapbusinessonline
5. Improvised collaboration: Collaboration improvises team performance. Data visualization makes the entire team collaborate as they can rely on the visual representation from the consolidated data. The whole team can have a unified opinion on a specific subject as the pictorial images present precise and clear information resolving all the complicated doubts.
6. Increased response time: As the data is shown in a simpler form, one can see the big picture with all the details. This increases the response time and improvises the decision making skill as the user can identify the problem immediately and act upon it. The best result one can get is that it saves the time of an individual and organization as a whole.
7. Imagining the best: Data visualization helps in imagining the best business results as the presented data in the most appealing pictorial format gives you clear insight and the overall idea of in which direction your business is headed to. The decision makers can confidently plan their strategy by analyzing these represented data.
8. Digging out the relevant data: One can utilize their business expertise in finding data patterns and answering queries, which even got overlooked by many of the highly qualified professionals.
The tool touches the untouched areas so that one can analyze where they are missing out in finding the relevant information hampering the business results of an organization. Once this information gets exposed, you can plan the strategy to make your marketing campaign successful outsmarting every competitor in your industry in a short period.
9. New business language: Data visualization is a new form of business language where it tells stories in the heat map form. One can see the revenue growth of a specific company across the United States with all the details. It even shows how the figures might vary on a state by state and city by city basis. The visualization form here along with the bird’s eye view provides you with the minute details enhancing the business process of the organization.
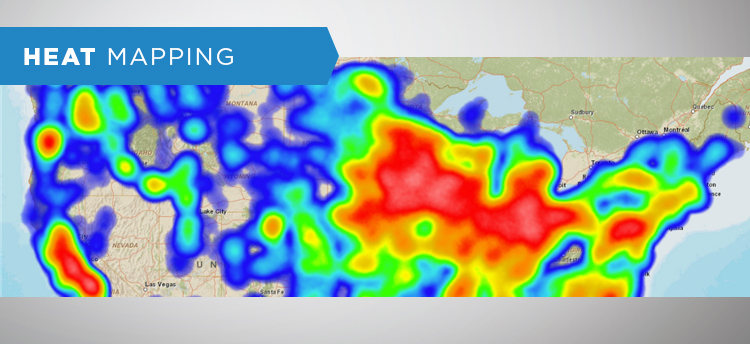 Source: Mapbusinessonline
10. Creating data-driven culture: It finally creates a data-driven culture within an organization which is necessary for the current market scenario. Data is the goldmine of information and if used correctly, can reap good business results for the organization. The visualization process makes your decision-making process an effective and streamlined one.
Wrapping up:
Data visualization can make the task easier for the employees and the organization as a whole. One can take the right decision easily with the insights gained from the pictorial representation of data. The complex data presented in a simple format can help in the accurate assessment of business growth.
A complete new approach in looking at the data steers your marketing process to achieve the desired results.